What Does January’s Inflation Report Mean for Treasuries?

Editor's note: Any and all references to time frames longer than one trading day are for purposes of market context only, and not recommendations of any holding time frame. Daily rebalancing ETFs are not meant to be held unmonitored for long periods. If you don't have the resources, time or inclination to constantly monitor and manage your positions, leveraged and inverse ETFs are not for you.
Treasury markets enjoyed a powerful rally off the October 2023 lows before peaking in late-December. During the period between October and December, there was a strong positive correlation between equity and Treasury markets. But that correlation has since broken, as stocks continued to new all-time highs while Treasury markets have been on the retreat.
Not long ago, there were expectations for the Federal Reserve to start cutting interest rates as soon as March of this year. However, a series of strong labor reports and hotter-than-expected inflation data is threatening the prospects of a Fed pivot.
Is a Double-Pivot a Possibility?
It wasn’t that long ago when Fed Chair Powell formerly acknowledged the likelihood of a pivot and rate cuts for financial markets. In fact, it was during the Fed’s December meeting. But at the time, there was a pretty consistent trend of inflation* data staying contained, even with the labor market being a bit stronger than expected.
The Fed probably could have gotten away with cutting rates despite the strong labor market, but if January’s inflation report wasn’t just a one-off anomaly, then there could be some serious problems for the macroeconomic doves.
Traders would be wise to keep a close watch on the next consumer price index (CPI)* release for the month of February on March 12. If this comes in above estimates, then it could push back rate cut odds even further.
Traders that think the prospect of delayed rate cuts could hurt the Treasury market could find a position with Direxion’s Daily 20+ Year Treasury Bear 3X Shares (Ticker: TMV), which seeks daily investment results, before fees and expenses, of 300% of the performance of the ICE U.S. Treasury 20+ Year Bond Index*.
Below is a daily chart of TMV as of February 15, 2024.
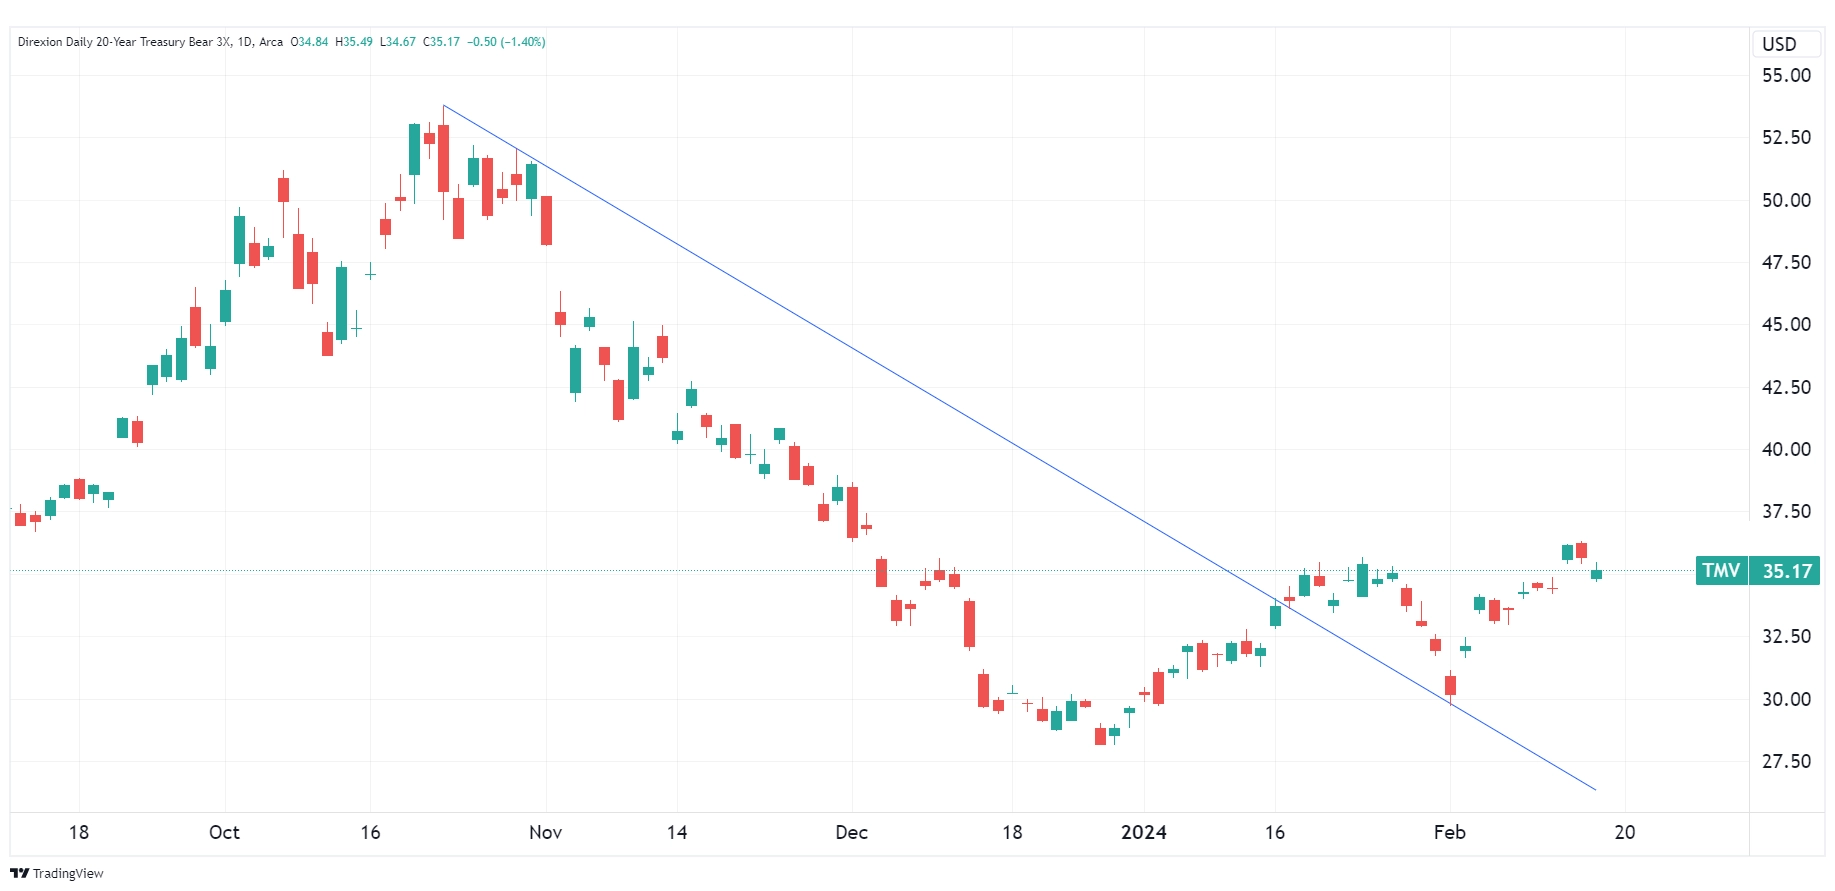
Source: TradingView.com
Candlestick charts display the high and low (the stick) and the open and close price (the body) of a security for a specific period. If the body is filled, it means the close was lower than the open. If the body is empty, it means the close was higher than the open.
The performance data quoted represents past performance. Past performance does not guarantee future results. The investment return and principal value of an investment will fluctuate. An investor’s shares, when redeemed, may be worth more or less than their original cost; current performance may be lower or higher than the performance quoted. For the most recent month-end performance go to Direxion.com/etfs. For standardized performance click here.
The slanted blue line represents a downtrend. A downtrend describes the price movement of a financial asset when the overall direction is downward.
A Labor Slowdown Could Induce Rate Cuts
Just because inflation increased in January doesn’t mean that the prospect for rate cuts is gone completely. The Fed probably would have eased sooner had it not been for the resiliency of the labor market.
As long as inflationary pressures don’t accelerate to the upside dramatically, a weakening labor market could be adequate for the Fed to justify rate cuts in the near future. In this case, it could turn out to be a potential boon for Treasury markets.
Traders need to keep any eye out for the next employment report, which is slated to be released on March 8 for the month of February. Any deterioration on this front could push forward the likelihood of rate cuts by the central bank.
In this scenario, Direxion’s Daily 20+ Year Treasury Bull 3X Shares (Ticker: TMF), which seeks daily investment results, before fees and expenses, of 300% of the performance of the ICE U.S. Treasury 20+ Year Bond Index, may be of interest to investors.
Below is a daily chart of TMF as of February 15, 2024.
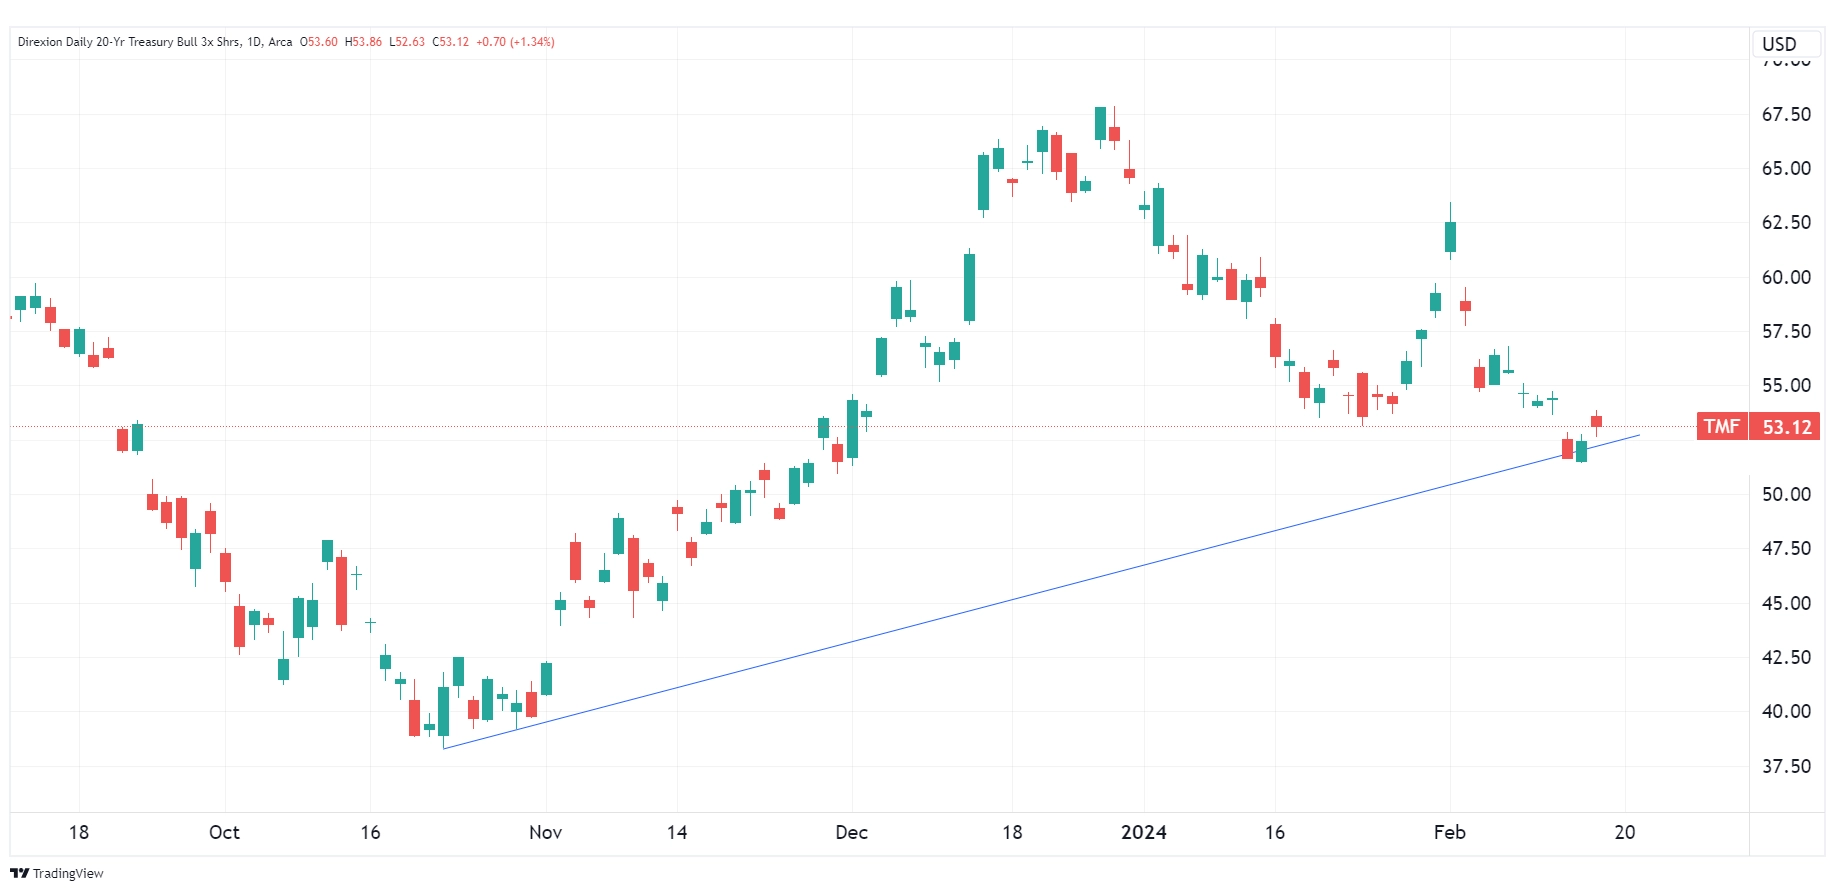
Source: TradingView.com
Candlestick charts display the high and low (the stick) and the open and close price (the body) of a security for a specific period. If the body is filled, it means the close was lower than the open. If the body is empty, it means the close was higher than the open.
The performance data quoted represents past performance. Past performance does not guarantee future results. The investment return and principal value of an investment will fluctuate. An investor’s shares, when redeemed, may be worth more or less than their original cost; current performance may be lower or higher than the performance quoted. For the most recent month-end performance go to Direxion.com/etfs. For standardized performance click here.
The slanted blue line represents an uptrend. An uptrend describes the price movement of a financial asset when the overall direction is upward.
Bond Plays with Less Duration
Traders looking for less duration risk when speculating in the Treasury space may find opportunities with Direxion’s Daily 7-10 Year Treasury Bull 3X Shares (Ticker: TYD) or Daily 7-10 Year Treasury Bear 3X Shares (Ticker: TYO), which seek daily investment results, before fees and expenses, of 300%, or -300%, respectively, of the performance of the ICE U.S. Treasury 7-10 Year Bond Index*.
*Definitions and Index Descriptions
An investor should carefully consider a Fund’s investment objective, risks, charges, and expenses before investing. A Fund’s prospectus and summary prospectus contain this and other information about the Direxion Shares. To obtain a Fund’s prospectus and summary prospectus call 866-476-7523 or visit our website at www.direxion.com. A Fund’s prospectus and summary prospectus should be read carefully before investing.
Leveraged and Inverse ETFs pursue daily leveraged investment objectives which means they are riskier than alternatives which do not use leverage. They seek daily goals and should not be expected to track the underlying index over periods longer than one day. They are not suitable for all investors and should be utilized only by sophisticated investors who understand leverage risk and who actively manage their investments.
The ICE U.S. Treasury 20+ Year Bond Index (IDCOT20TR) is a market value weighted index that includes publicly issued U.S. Treasury securities that have a remaining maturity of greater than 20 years. Eligible securities must be fixed rate, denominated in U.S. dollars, and have $300 million or more of outstanding face value, excluding amounts held by the Federal Reserve. Securities excluded from the Index are inflation-linked securities, Treasury bills, cash management bills, any government agency debt issued with or without a government guarantee and zero-coupon issues that have been stripped from coupon-paying bonds.
The ICE U.S. Treasury 7-10 Year Bond Index (IDCOT7TR) is a market value weighted index that includes publicly issued U.S. Treasury securities that have a remaining maturity of greater than seven years and less than or equal to ten years. Eligible securities must be fixed rate, denominated in U.S. dollars, and have $300 million or more of outstanding face value, excluding amounts held by the Federal Reserve. Securities excluded from the Index are inflation-linked securities, Treasury bills, cash management bills, any government agency debt issued with or without a government guarantee and zero-coupon issues that have been stripped from coupon-paying bonds.
One cannot directly invest in an index.
Neither Rafferty nor the Direxion Daily 7-10 Year Treasury Bull 3X Shares, Direxion Daily 7-10 Year Treasury Bear 3X Shares, Direxion Daily 20+ Year Treasury Bull 3X Shares or Direxion Daily 20+ Year Treasury Bear 3X Shares (the “Financial Products”) are sponsored, endorsed, sold or promoted by Interactive Data Pricing and Reference Data, LLC or its affiliates (“Vendor”). Vendor makes no representation or warranty regarding the advisability of investing in securities generally, in the Financial Products particularly, or the ability of the ICE U.S. Treasury 7-10 Year Bond Index or ICE U.S. Treasury 20+ Year Bond Index to track general financial market performance. VENDOR MAKES NO EXPRESS OR IMPLIED WARRANTIES, AND HEREBY EXPRESSLY DISCLAIMS ALL WARRANTIES OF MERCHANTABILITY OR FITNESS FOR A PARTICULAR PURPOSE WITH RESPECT TO THE ICE INDICES OR ANY DATA INCLUDED THEREIN. IN NO EVENT SHALL VENDOR HAVE ANY LIABILITY FOR ANY SPECIAL, PUNITIVE, INDIRECT, OR CONSEQUENTIAL DAMAGES (INCLUDING LOST PROFITS), EVEN IF NOTIFIED OF THE POSSIBILITY OF SUCH DAMAGES.
Direxion Shares Risks – An investment in each Fund involves risk, including the possible loss of principal. Each Fund is non-diversified and includes risks associated with the Funds’ concentrating their investments in a particular industry, sector, or geographic region which can result in increased volatility. The use of derivatives such as futures contracts and swaps are subject to market risks that may cause their price to fluctuate over time. Risks of each Fund include Effects of Compounding and Market Volatility Risk, Leverage Risk, Market Risk, Aggressive Investment Techniques Risk, Counterparty Risk, Intra-Day Investment Risk, Other Investment Companies (including ETFs) Risk, Cash Transaction Risk, Tax Risk, and risks specific to U.S. Government Securities. Additional risks include, for the Direxion Daily 20+ Year Bull 3X Shares, Daily Index Correlation Risk, and for the Direxion Daily 20+ Year Treasury Bear 3X Shares, Daily Inverse Index Correlation Risk, and risks related to Shorting. A security backed by the U.S. Treasury or the full faith and credit of the United States is guaranteed only as to the timely payment of interest and principal when held to maturity. The market prices for such securities are not guaranteed and will fluctuate. Please see the summary and full prospectuses for a more complete description of these and other risks of each Fund.
Distributor: Foreside Fund Services, LLC.