Navigating Seasonality, Earnings Surprises, and Consumer Sentiment

Editor's note: Any and all references to time frames longer than one trading day are for purposes of market context only, and not recommendations of any holding time frame. Daily rebalancing ETFs are not meant to be held unmonitored for long periods. If you don't have the resources, time or inclination to constantly monitor and manage your positions, leveraged and inverse ETFs are not for you.
Stocks enjoyed a strong rally from October 2022 up until July of this year. But since then, we’ve seen equity markets on the defensive. Many have attributed the decline to seasonal weakness, others to a surprise rise in interest rates. The question on the mind of traders is whether seasonally bullish factors can save the market from a prolonged retreat into the fourth quarter.
Can Earnings and Seasonality Be a Saving Grace?
Interestingly, the weakness in equity markets began to accelerate during the months of August and September, which historically, are the weakest months of the year with respect to performance.
However, the final three months of the year, and especially December, tell a much different tale. Is historical seasonal performance suggesting a rebound in stocks in the coming weeks, or, is this time really different? Earnings season is also right around the corner, so if general guidance comes in above estimates, we could have another catalyst for a potential rebound.
Traders looking for a technical bounce in stocks, especially with supportive seasonal factors, may find an opportunity with Direxion’s Daily S&P 500® Bull 3X Shares (Ticker: SPXL), which seeks daily investment results, before fees and expenses, of 300% of the performance of the S&P 500® Index*.
SPXL’s top holdings as of September 30, 2023 include Apple (Ticker: AAPL), Microsoft (Ticker: MSFT), and Amazon (Ticker: AMZN). Apple is set to report earnings on October 26, and estimates are for an earnings-per-share (EPS)* of $1.39. Microsoft reports on October 24, and analysts are looking for an EPS of $2.65. Amazon’s earnings are on October 26, and analysts are seeking an EPS of $0.58. An upside surprise from any of these companies could be enough to propel the S&P 500® Index back higher.
To view the fund’s full holdings, click here. Holdings are subject to risk and change.
Below is a daily chart of SPXL as of October 5, 2023.
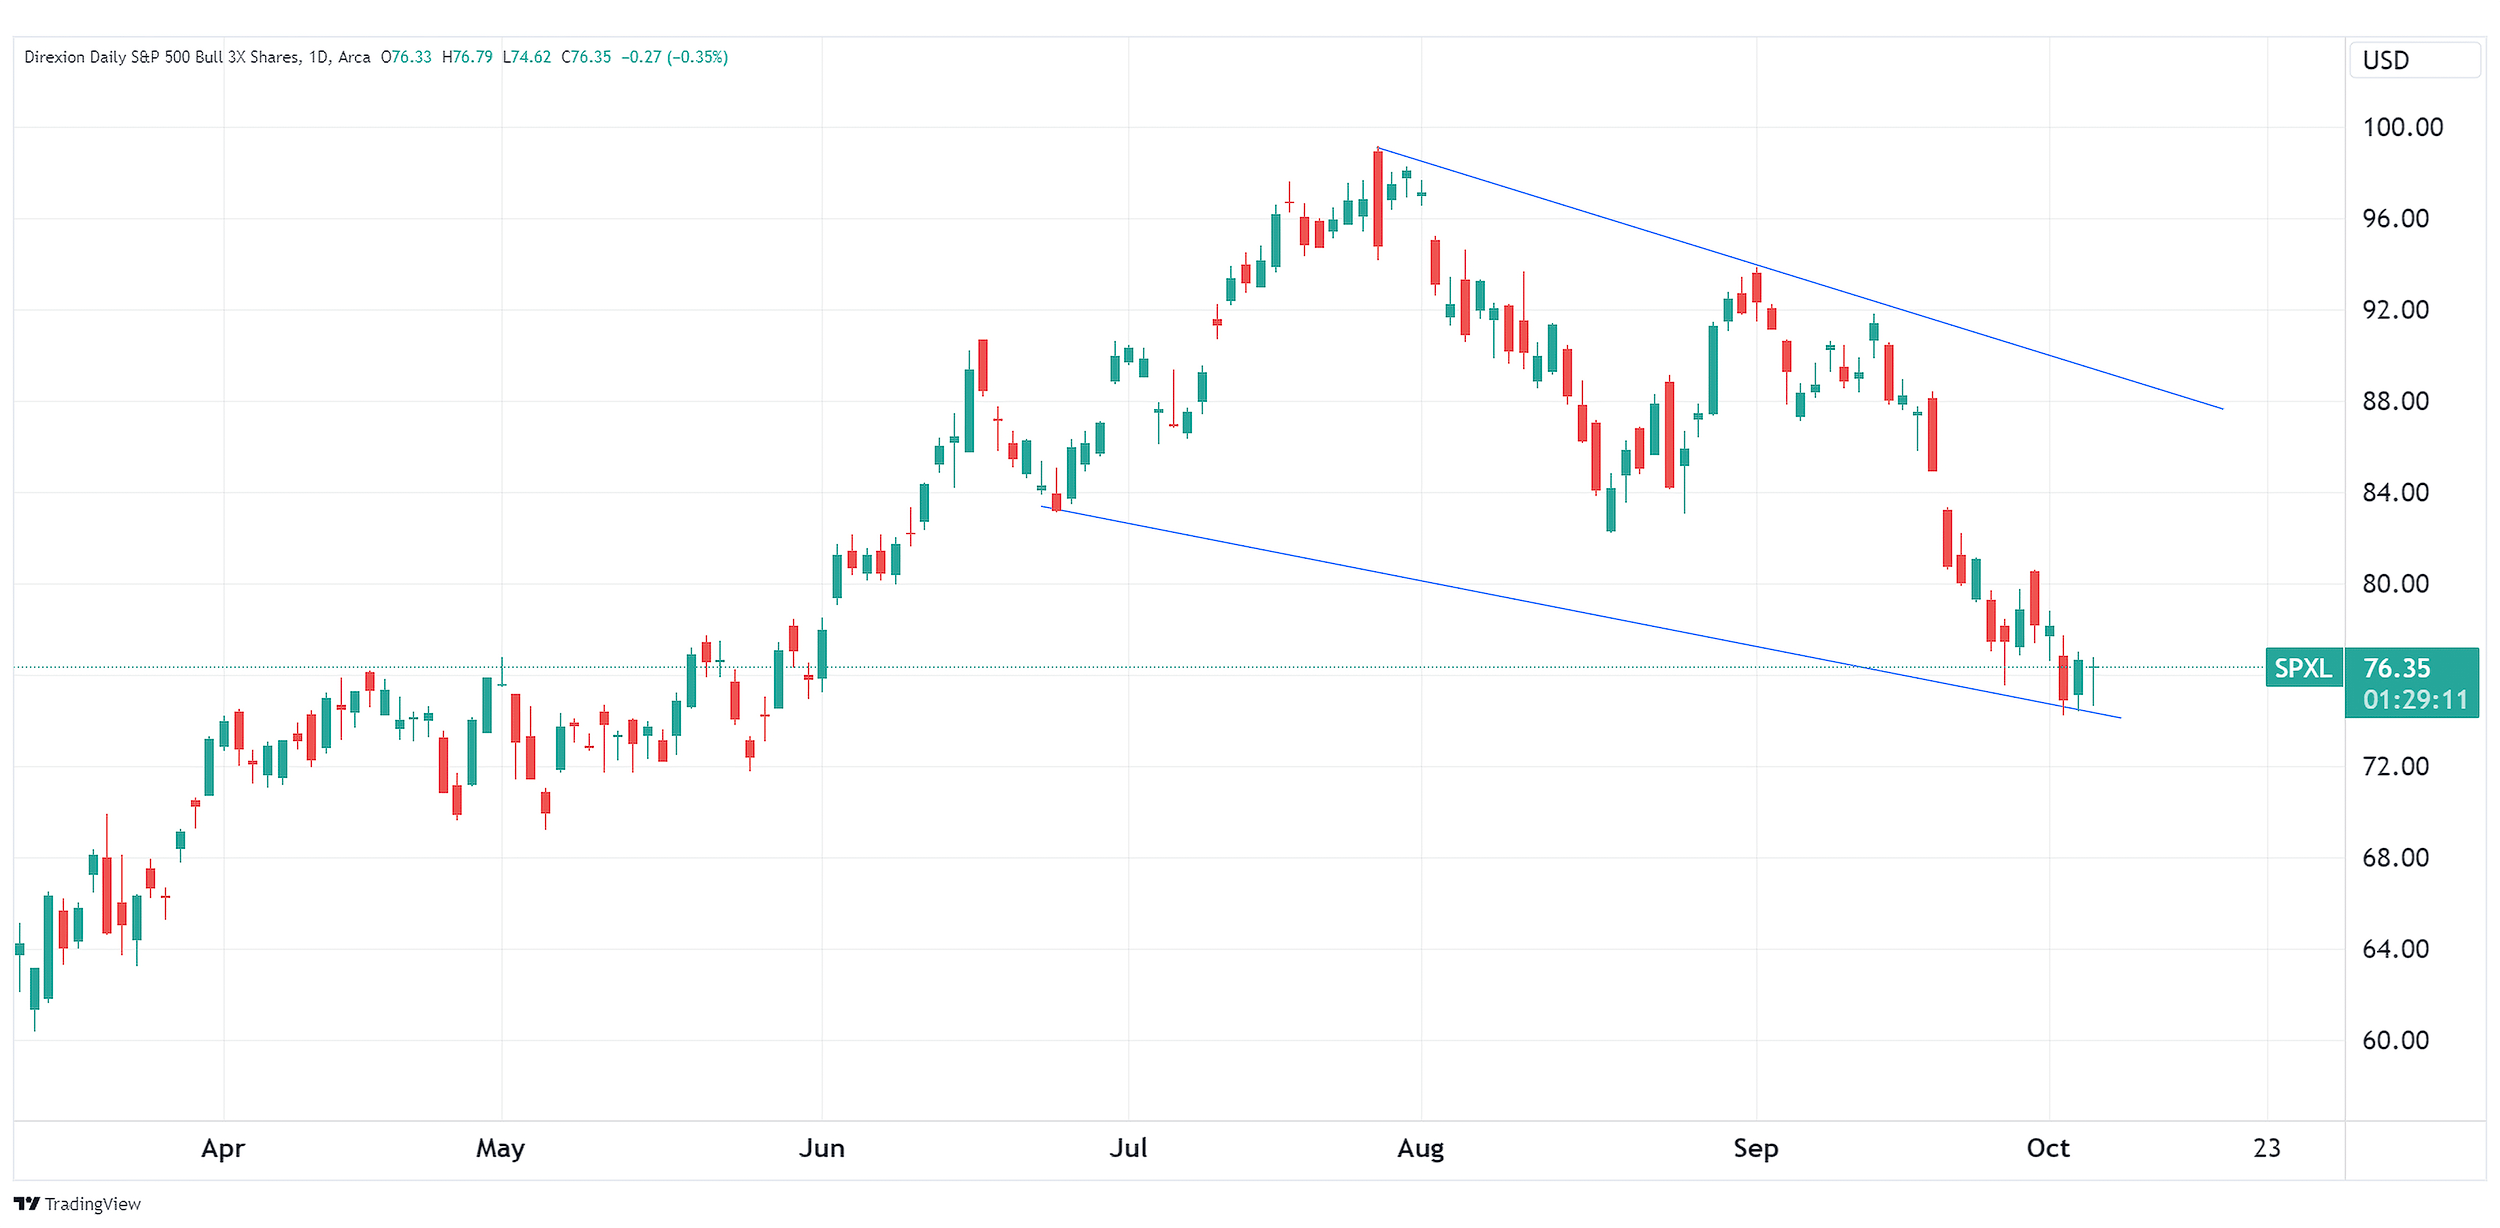
Source: TradingView.com
Candlestick charts display the high and low (the stick) and the open and close price (the body) of a security for a specific period. If the body is filled, it means the close was lower than the open. If the body is empty, it means the close was higher than the open.
The performance data quoted represents past performance. Past performance does not guarantee future results. The investment return and principal value of an investment will fluctuate. An investor’s shares, when redeemed, may be worth more or less than their original cost; current performance may be lower or higher than the performance quoted. For the most recent month-end performance go to Direxion.com/etfs. For standardized performance click here.
What if Seasonality Fails?
With inflationary pressures threatening to make a comeback, stock markets are starting to discount the possibility of a notable shift in consumer behavior. Consumption makes up around 70% of U.S. gross domestic product (GDP)*, and if prices start to rise again, we could see a reduction in discretionary spending.
Any meaningful shift on consumer behavior could impact revenue and earnings reports of major companies and justify a continued correction in stocks. However, in recent years, it hasn’t been wise to bet against the American consumer.
Traders that prefer the bearish case in U.S. large cap stocks due to shifting consumer behaviors may find a short-term position with Direxion’s Daily S&P 500® Bear 3X Shares (Ticker: SPXS), which seeks daily investment results, before fees and expenses, of 300% of the inverse (or opposite), of the performance of the S&P 500® Index.
To view the fund’s full holdings, click here. Holdings are subject to risk and change.
Below is a daily chart of SPXS as of October 5, 2023.
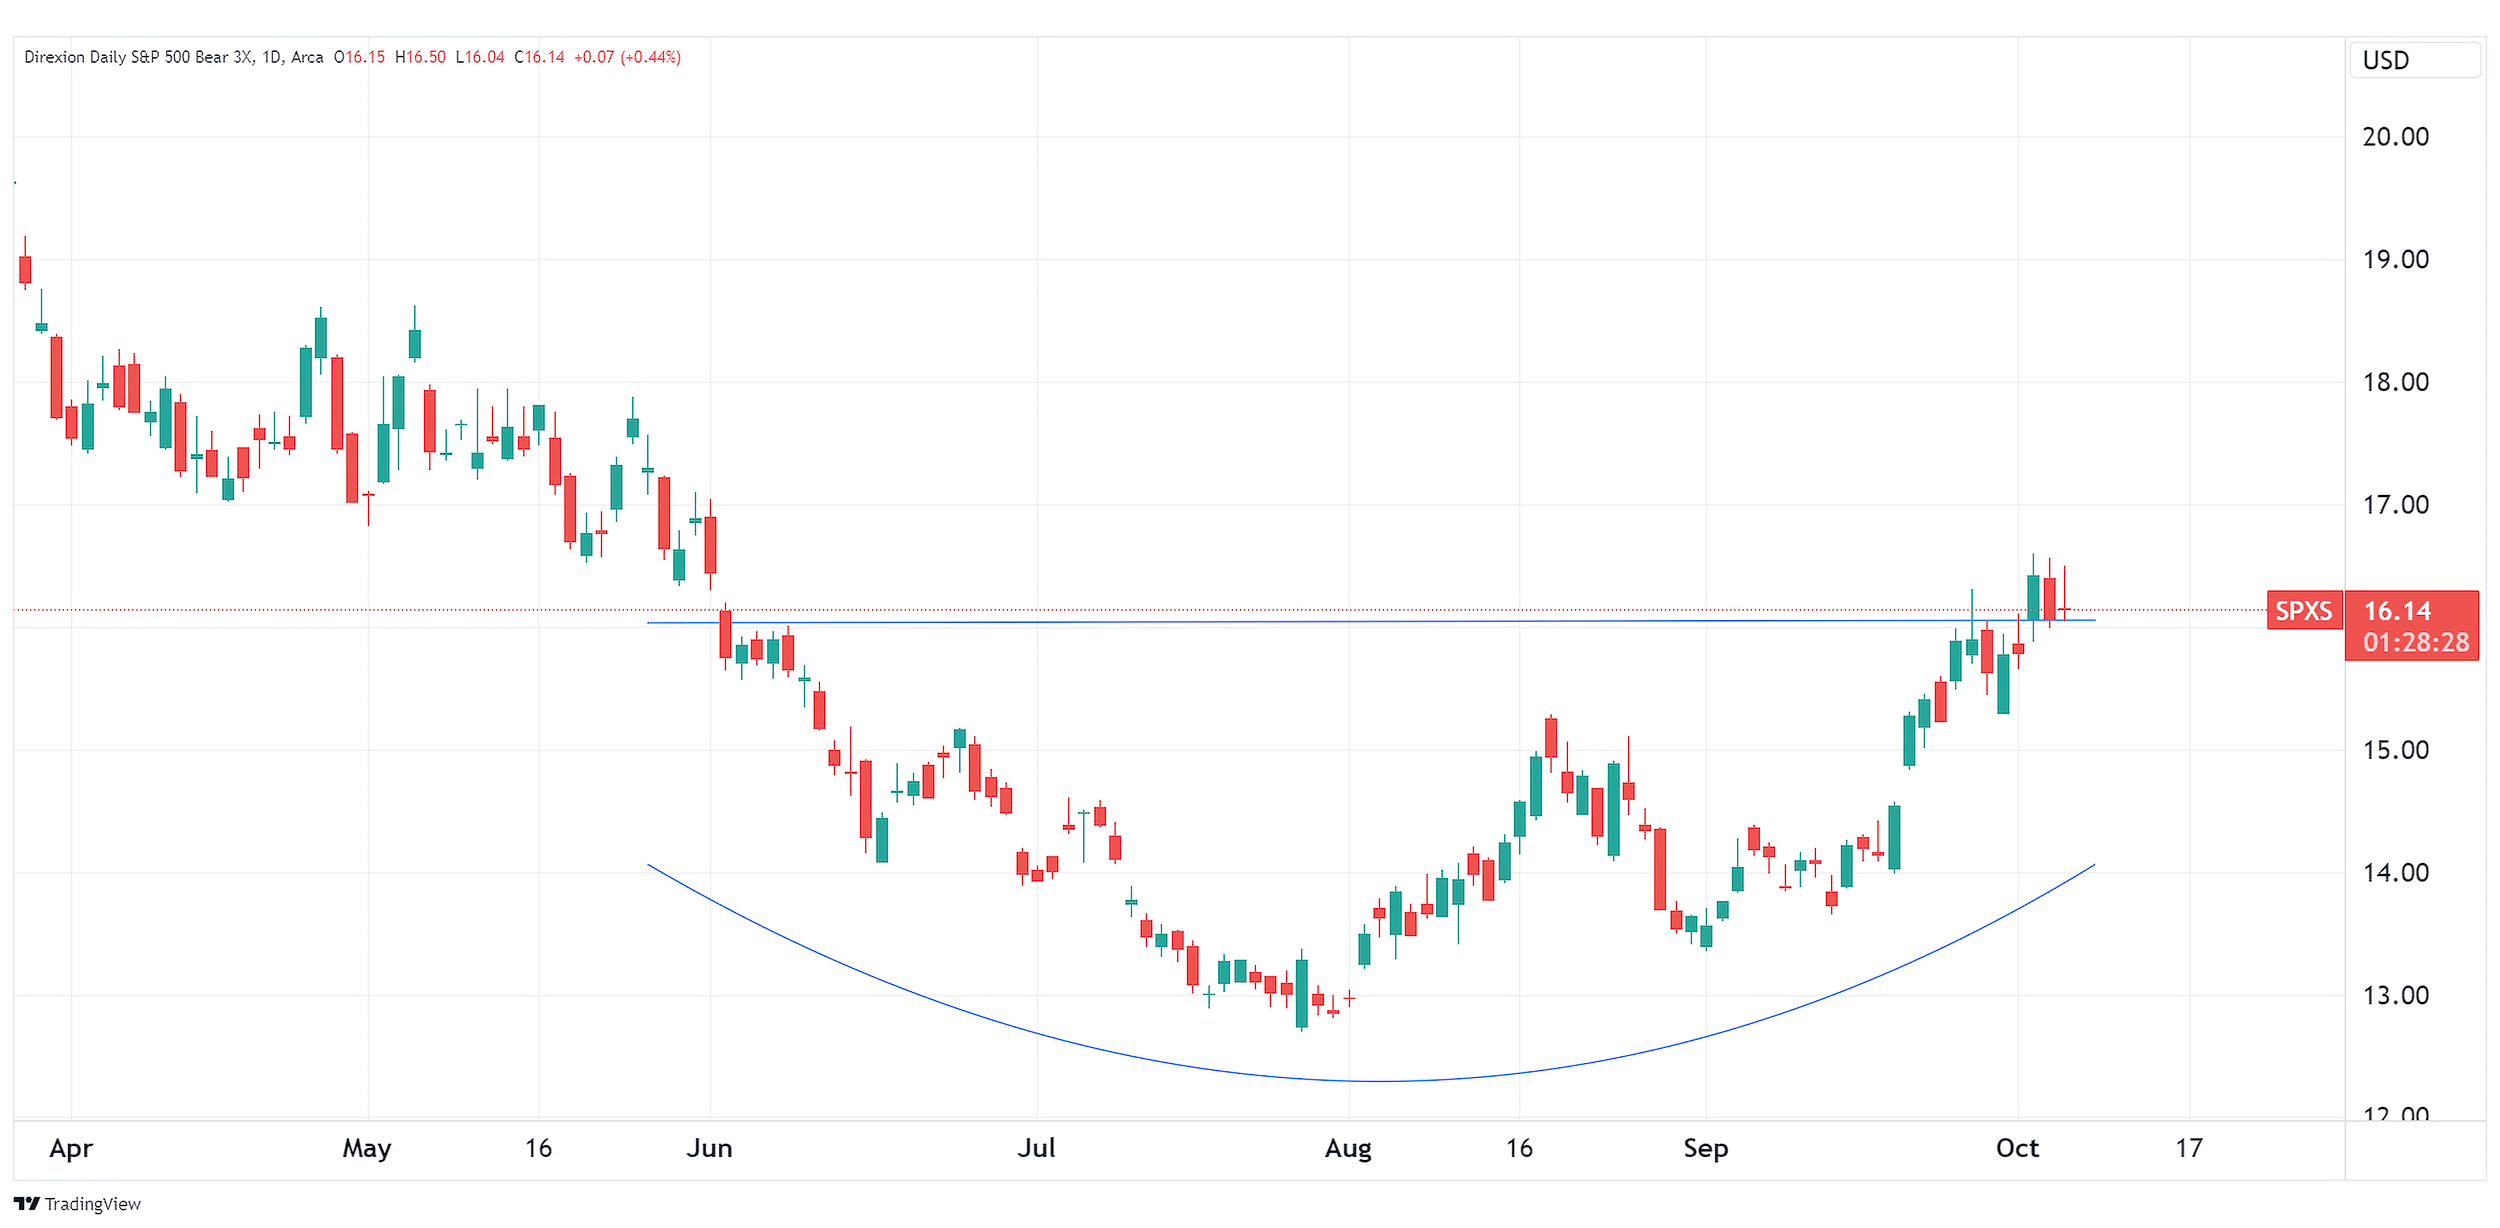
Source: TradingView.com
Candlestick charts display the high and low (the stick) and the open and close price (the body) of a security for a specific period. If the body is filled, it means the close was lower than the open. If the body is empty, it means the close was higher than the open.
The performance data quoted represents past performance. Past performance does not guarantee future results. The investment return and principal value of an investment will fluctuate. An investor’s shares, when redeemed, may be worth more or less than their original cost; current performance may be lower or higher than the performance quoted. For the most recent month-end performance go to Direxion.com/etfs. For standardized performance click here.
Concentrated Equity Plays
Traders with a more speculative appetite seeking more concentrated plays in the equity market may want to consider Direxion’s single stock ETFs. These innovative funds provide traders an opportunity to take on leveraged or inverse exposure in stocks like Apple, Amazon, Google, Microsoft, Nvidia, and Tesla.
The Direxion Daily AAPL Bull 1.5X Shares (Ticker: AAPU) and Direxion Daily AAPL Bear 1X Shares (Ticker: AAPD) seek daily investment results, before fees and expenses, of 150% and 100% of the inverse (or opposite), respectively, of the performance of the common shares of Apple Inc. (NASDAQ: AAPL).
The Direxion Daily AMZN Bull 1.5X Shares (Ticker: AMZU) and Direxion Daily AMZN Bear 1X Shares (Ticker: AMZD) seek daily investment results, before fees and expenses, of 150% and 100% of the inverse (or opposite), respectively, of the performance of the common shares of Amazon.com, Inc. (NASDAQ: AMZN).
The Direxion Daily GOOGL Bull 1.5X Shares (Ticker: GGLL) and Direxion Daily GOOGL Bear 1X Shares (Ticker: GGLS) seek daily investment results, before fees and expenses, of 150% and 100% of the inverse (or opposite), respectively, of the performance of the Class A shares of Alphabet Inc. (NASDAQ: GOOGL).
The Direxion Daily MSFT Bull 1.5X Shares (Ticker: MSFU) and Direxion Daily MSFT Bear 1X Shares (Ticker: MSFD) seek daily investment results, before fees and expenses, of 150% and 100% of the inverse (or opposite), respectively, of the performance of the common shares of Microsoft Corporation (NASDAQ: MSFT).
The Direxion Daily NVDA Bull 1.5X Shares (Ticker: NVDU) and Direxion Daily NVDA Bear 1X Shares (Ticker: NVDD) seek daily investment results, before fees and expenses, of 150% and 100% of the inverse (or opposite), respectively, of the performance of the common shares of NVIDIA Corporation (NASDAQ: NVDA).
The Direxion Daily TSLA Bull 1.5X Shares (Ticker: TSLL) and Direxion Daily TSLA Bear 1X Shares (Ticker: TSLS) seek daily investment results, before fees and expenses, of 150% and 100% of the inverse (or opposite), respectively, of the performance of the common shares of Tesla, Inc. (NASDAQ: TSLA).
*Definitions and Index Descriptions
Investing in the funds involves a high degree of risk. Unlike traditional ETFs, or even other leveraged and/or inverse ETFs, these leveraged and/or inverse single-stock ETFs track the price of a single stock rather than an index, eliminating the benefits of diversification. Leveraged and inverse ETFs pursue daily leveraged investment objectives, which means they are riskier than alternatives which do not use leverage. They seek daily goals and should not be expected to track the underlying stock’s performance over periods longer than one day. They are not suitable for all investors and should be utilized only by investors who understand leverage risk and who actively manage their investments. The Funds will lose money if the underlying stock’s performance is flat, and it is possible that the Bull Fund will lose money even if the underlying stock’s performance increases, and the Bear Fund will lose money even if the underlying stock’s performance decreases, over a period longer than a single day. An investor could lose the full principal value of his or her investment in a single day. Investing in the Funds is not the same as investing directly in AAPL, AMZN, GOOGL, MSFT, NVDA, or TSLA.
An investor should carefully consider a Fund’s investment objective, risks, charges, and expenses before investing. A Fund’s prospectus and summary prospectus contain this and other information about the Direxion Shares. To obtain a Fund’s prospectus and summary prospectus call 866-476-7523 or visit our website at www.direxion.com. A Fund’s prospectus and summary prospectus should be read carefully before investing.
Leveraged and Inverse ETFs pursue daily leveraged investment objectives which means they are riskier than alternatives which do not use leverage. They seek daily goals and should not be expected to track the underlying index over periods longer than one day. They are not suitable for all investors and should be utilized only by sophisticated investors who understand leverage risk and who actively manage their investments.
The “S&P 500 Index" is a product of S&P Dow Jones Indices LLC ("SPDJI"), and has been licensed for use by Rafferty Asset Management, LLC ("Rafferty"). Standard & Poor’s® and S&P® are registered trademarks of Standard & Poor’s Financial Services LLC ("S&P"); Dow Jones® is a registered trademark of Dow Jones Trademark Holdings LLC ("Dow Jones"); and these trademarks have been licensed for use by SPDJI and sublicensed for certain purposes by Rafferty. Rafferty’s ETFs are not sponsored, endorsed, sold or promoted by SPDJI, Dow Jones, S&P, their respective affiliates and none of such parties make any representation regarding the advisability of investing in such product(s) nor do they have any liability for any errors, omissions, or interruptions of the S&P 500® Index.
The S&P 500® Index (SPXT) is designed to be comprised of stocks that are the 500 leading, large-cap U.S. listed issuers. The securities are selected on the basis of market capitalization, financial viability of the company, sector representation, public float, liquidity and price of a company’s shares outstanding. The Index is a float-adjusted, market capitalization-weighted index. One cannot directly invest in an index.
Direxion Shares Risks - An investment in each Fund involves risk, including the possible loss of principal. Each Fund is non-diversified and includes risks associated with the Funds’ concentrating their investments in a particular industry, sector, or geographic region which can result in increased volatility. The use of derivatives such as futures contracts and swaps are subject to market risks that may cause their price to fluctuate over time. Risks of each Fund include Effects of Compounding and Market Volatility Risk, Leverage Risk, Market Risk, Counterparty Risk, Rebalancing Risk, Intra-Day Investment Risk, Other Investment Companies (including ETFs) Risk, Cash Transaction Risk, Tax Risk, and risks specific to the securities that comprise the S&P 500® Index. Additional risks include, for the Direxion Daily S&P 500® Bull 3X Shares, Daily Index Correlation Risk and for the Direxion Daily S&P 500® Bear 3X Shares, Daily Inverse Index Correlation Risk, and risks related to Shorting. Please see the summary and full prospectuses for a more complete description of these and other risks of each Fund.
Distributor: Foreside Fund Services, LLC.