Navigating Rate Cut Ripples: Will S&P 500 Sink or Swim?

Editor's note: Any and all references to time frames longer than one trading day are for purposes of market context only, and not recommendations of any holding time frame. Daily rebalancing ETFs are not meant to be held unmonitored for long periods. If you don't have the resources, time or inclination to constantly monitor and manage your positions, leveraged and inverse ETFs are not for you.
Earnings season is winding down, and for the most part, the results have been impressive. Strong beats by Magnificent 7 companies like Netflix and Meta have helped propel stock indices higher despite poor results from fellow members Tesla and Google. With the potential for rate cuts in the coming months, is this enough to keep pushing stocks higher, or is something else brewing under the surface?
Can Liquidity Prospects Keep Equities Elevated?
Back in December, Fed Chair Powell formally pivoted the central bank from a hawkish to dovish stance. Stocks were already rallying a couple months before then, but the bid began to accelerate shortly thereafter.
The market was initially expecting rate cuts in March, but after a series of strong employment numbers, it looks like the probability of the first rate cut has been pushed back to the Fed’s May meeting.
Traders that think the prospect of more liquidity could lead to a continued bull market in equities may find an opportunity with Direxion’s Daily S&P 500 Bull 3X Shares (Ticker: SPXL), which seeks daily investment results, before fees and expenses, of 300% of the performance of the S&P 500 Index*.
Below is a daily chart of SPXL as of February 9, 2024.
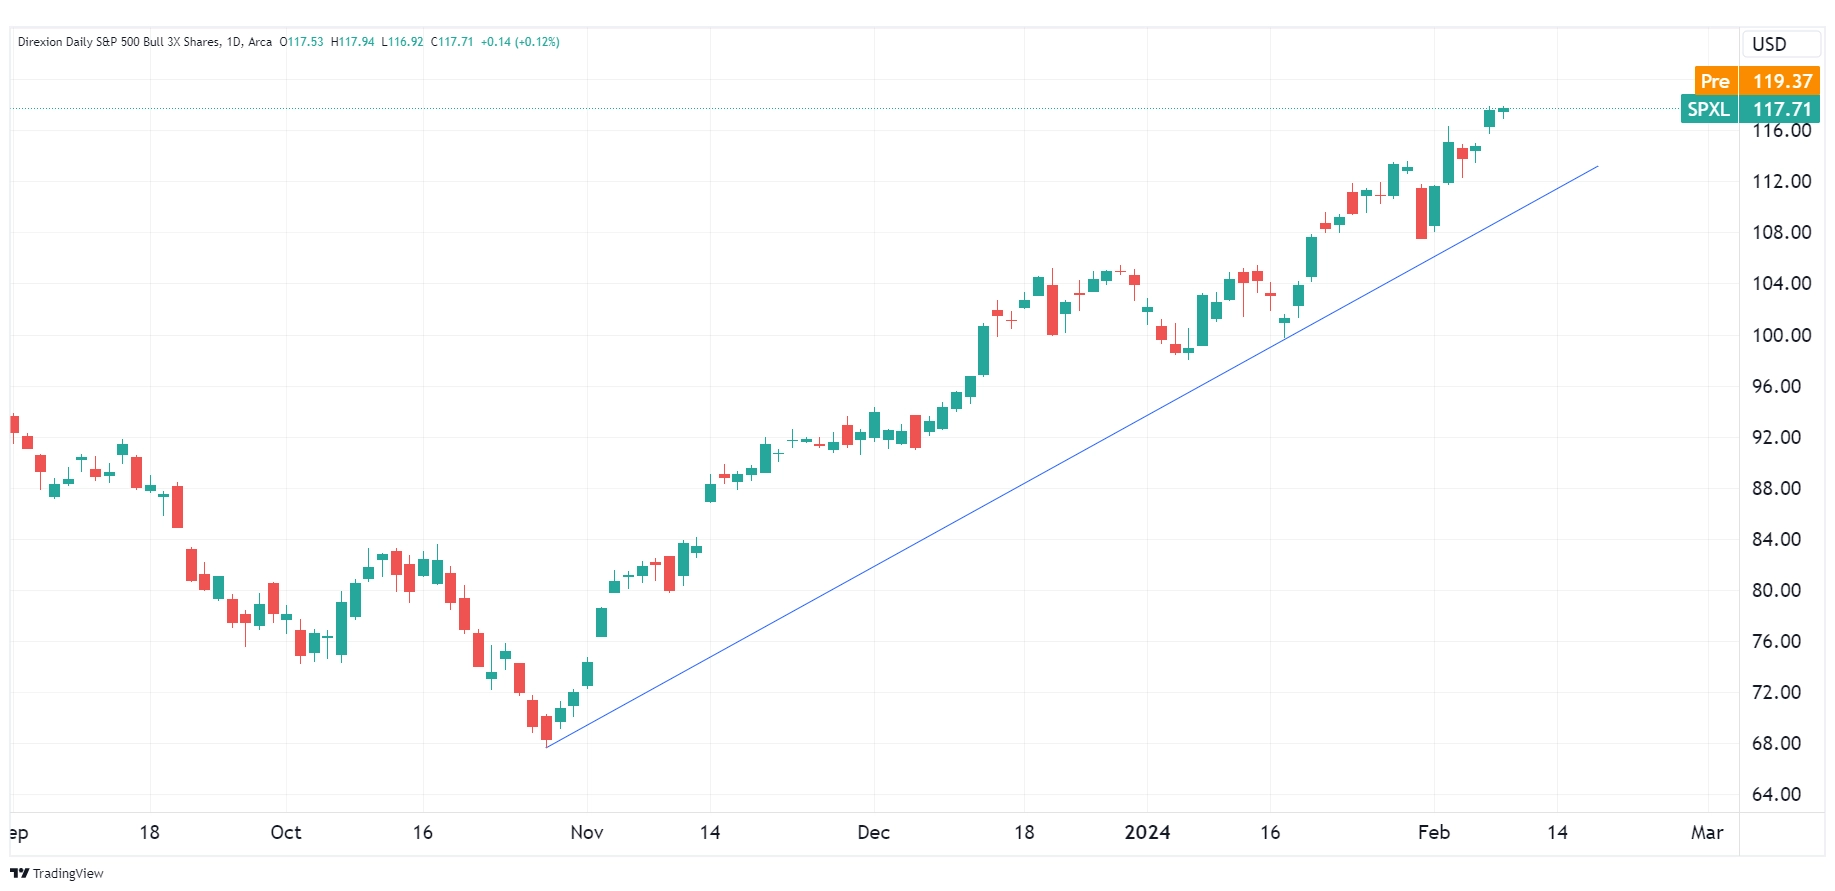
Source: TradingView.com
Candlestick charts display the high and low (the stick) and the open and close price (the body) of a security for a specific period. If the body is filled, it means the close was lower than the open. If the body is empty, it means the close was higher than the open.
The performance data quoted represents past performance. Past performance does not guarantee future results. The investment return and principal value of an investment will fluctuate. An investor’s shares, when redeemed, may be worth more or less than their original cost; current performance may be lower or higher than the performance quoted. For the most recent month-end performance go to Direxion.com/etfs. For standardized performance click here.
The slanted blue line represents an uptrend. An uptrend describes the price movement of a financial asset when the overall direction is upward.
Could Rate Cuts Signal a Slowdown?
In reality, rate cuts are a double-edged sword. While the prospect of greater liquidity is generally a tailwind for equity performance, it can also signal that the economy is no longer able to handle higher interest rates.
Given that inflation* is contained, it all comes down to the labor market now. If its strength continues, we could see rate cut odds continue to be pushed back, which could damper the likelihood of rate cuts near-term.
However, if unemployment does start to spike, as recent reports of layoffs suggest they could, it may signal that we’re going into a recession. Traders would be wise to keep an eye on the upcoming unemployment report on March 8. If we see an uptick in the unemployment rate, it could signal an early warning sign that a recession is coming.
In this scenario, Direxion’s Daily S&P 500 Bear 3X Shares (Ticker: SPXS), which seeks daily investment results, before fees and expenses, of 300% of the inverse (or opposite) of the performance of the S&P 500 Index, may provide a unique opportunity.
Below is a daily chart of SPXS as of February 9, 2024.
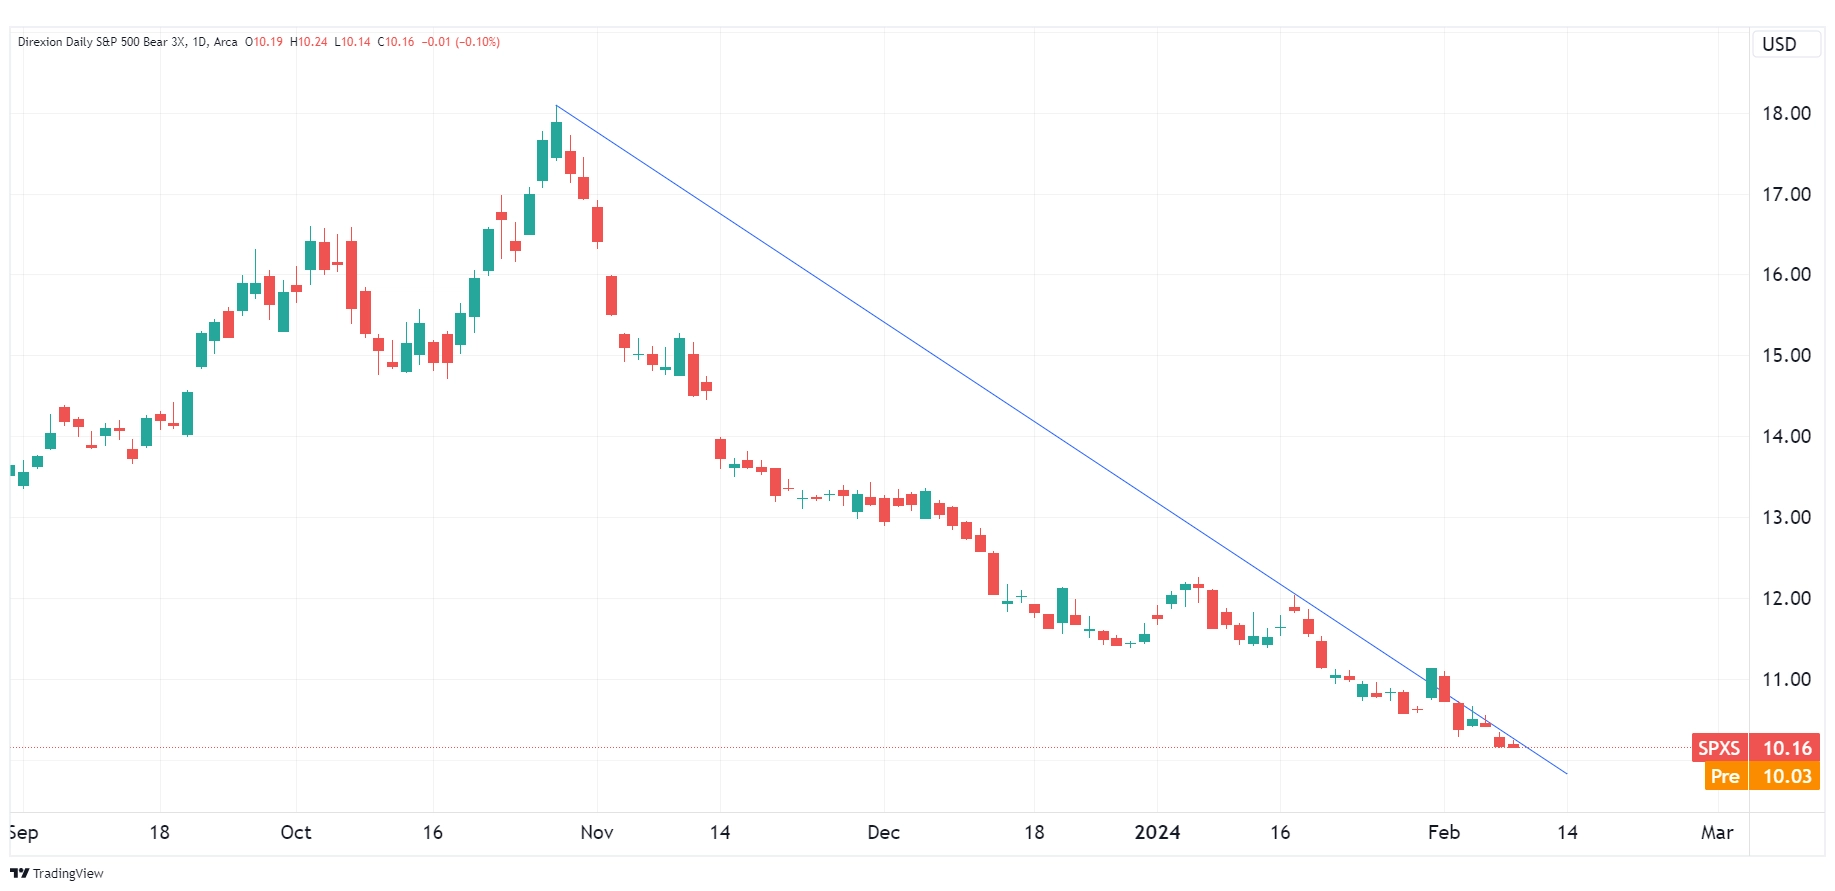
Source: TradingView.com
Candlestick charts display the high and low (the stick) and the open and close price (the body) of a security for a specific period. If the body is filled, it means the close was lower than the open. If the body is empty, it means the close was higher than the open.
The performance data quoted represents past performance. Past performance does not guarantee future results. The investment return and principal value of an investment will fluctuate. An investor’s shares, when redeemed, may be worth more or less than their original cost; current performance may be lower or higher than the performance quoted. For the most recent month-end performance go to Direxion.com/etfs. For standardized performance click here.
The slanted blue line represents a downtrend. A downtrend describes the price movement of a financial asset when the overall direction is downward.
More Equity Plays
Traders opting to trade the small cap* sector instead of large caps* may be interested in Direxion’s Daily Small Cap Bull 3X Shares (Ticker: TNA) or Daily Small Cap Bear 3X Shares (Ticker: TZA), which seek daily investment results, before fees and expenses, of 300%, or -300%, respectively, of the performance of the Russell 2000 Index*. There’s also the Direxion Daily Mid Cap Bull 3X Shares (Ticker: MIDU), which seeks daily investment results, before fees and expenses, of 300% of the performance of the S&P Mid Cap 400 Index*.
Traders seeking international exposure with a bit more risk may find an opportunity in the Direxion Daily MSCI Emerging Markets Bull 3X Shares (Ticker: EDC) or Daily MSCI Emerging Markets Bear 3X Shares (Ticker: EDZ), which seek daily investment results, before fees and expenses, of 300%, or -300%, respectively, of the performance of the MSCI Emerging Markets Index*.
*Definitions and Index Descriptions
An investor should carefully consider a Fund’s investment objective, risks, charges, and expenses before investing. A Fund’s prospectus and summary prospectus contain this and other information about the Direxion Shares. To obtain a Fund’s prospectus and summary prospectus call 866-476-7523 or visit our website at direxion.com. A Fund’s prospectus and summary prospectus should be read carefully before investing.
Leveraged and Inverse ETFs pursue daily leveraged investment objectives which means they are riskier than alternatives which do not use leverage. They seek daily goals and should not be expected to track the underlying index over periods longer than one day. They are not suitable for all investors and should be utilized only by sophisticated investors who understand leverage risk and who actively manage their investments.
The S&P 500® Index (SPXT) is designed to be comprised of stocks that are the 500 leading, large-cap U.S. listed issuers. The securities are selected on the basis of market capitalization, financial viability of the company, sector representation, public float, liquidity and price of a company’s shares outstanding. The Index is a float-adjusted, market capitalization-weighted index.
The Russell 2000® Index (RU20INTR) measures the performance of approximately 2,000 small-capitalization companies in the Russell 3000® Index, based on a combination of their market capitalization.
The S&P MidCap 400® Index (SPTRMDCP) is a float-adjusted market capitalization weighted index that measures the performance of 400 mid-sized companies in the United States.
The MSCI Emerging Market IndexSM (NDUEEGF) is a free float-adjusted market capitalization weighted index that is designed to represent the performance of large- and mid-capitalization securities across emerging markets countries.
One cannot directly invest in an index.
The “S&P 500 Index” is a product of S&P Dow Jones Indices LLC (“SPDJI”), and has been licensed for use by Rafferty Asset Management, LLC (“Rafferty”). Standard & Poor’s® and S&P® are registered trademarks of Standard & Poor’s Financial Services LLC (“S&P”); Dow Jones® is a registered trademark of Dow Jones Trademark Holdings LLC (“Dow Jones”); and these trademarks have been licensed for use by SPDJI and sublicensed for certain purposes by Rafferty. Rafferty’s ETFs are not sponsored, endorsed, sold or promoted by SPDJI, Dow Jones, S&P, their respective affiliates and none of such parties make any representation regarding the advisability of investing in such product(s) nor do they have any liability for any errors, omissions, or interruptions of the S&P 500® Index.
Direxion Shares Risks — An investment in each Fund involves risk, including the possible loss of principal. Each Fund is non-diversified and includes risks associated with the Funds’ concentrating their investments in a particular industry, sector, or geographic region which can result in increased volatility. The use of derivatives such as futures contracts and swaps are subject to market risks that may cause their price to fluctuate over time. Risks of each Fund include Effects of Compounding and Market Volatility Risk, Leverage Risk, Market Risk, Counterparty Risk, Rebalancing Risk, Intra-Day Investment Risk, Other Investment Companies (including ETFs) Risk, Cash Transaction Risk, Tax Risk, and risks specific to the securities that comprise the S&P 500® Index. Additional risks include, for the Direxion Daily S&P 500® Bull 3X Shares, Daily Index Correlation Risk and for the Direxion Daily S&P 500® Bear 3X Shares, Daily Inverse Index Correlation Risk, and risks related to Shorting. Please see the summary and
Distributor: Foreside Fund Services, LLC.