Direxion Auspice Broad Commodity Strategy ETF
The Direxion Auspice Broad Commodity Strategy ETF seeks investment results, before fees and expenses, that track the Auspice Broad Commodity Index. There is no guarantee the fund will achieve its stated investment objective.
COM
Overall Morningstar Rating
Overall Morningstar RatingTM out of 100 US Fund Commodities Broad Basket funds based on risk adjusted returns as of 03/31/2024†.
Operational Updates
- 04/17/2024
Q1 2024 COMmodity Recap
Read Full Article - 01/23/2024
Direxion's New ETF Alert Service. Get Price and Volume Alerts automatically via text message!
Set Up Your ETF Alerts Today
Documents & Downloads
Strategy & Benefits
Strategy Description
- A 40 Act, non K-1 generating approach to commodity investing
- Exposure to 12 commodities that can individually be long or flat (if a short signal is triggered the position is moved to cash)
- The ability to make position changes intra-month based on trends
- Month-end review where the position size of each component is modified if volatility exceeds certain predetermined risk levels
- A “smart” contract roll approach designed to select cost effective futures contracts to roll into upon expiration of current contract.
Most traditional commodity funds can only benefit if commodity prices rise. However, these long-only commodity strategies have shown to be inconsistent over time because:
- Commodity returns are typically cyclical and sporadic
- Individual commodity sub-sectors tend to perform dissimilarly in different market environments
- Significant draw-downs can be damaging to the long-term performance of a portfolio
Within the inherently volatile commodity markets, a long/flat approach is potentially more adaptive to whip-sawing market conditions.
Fund Details
Component Sectors and Current Positioning
| Metals | Position (Long/Flat) |
| Copper | Long |
| Gold | Long |
| Silver | Long |
| Agriculture | |
| Soybeans | Flat |
| Corn | Flat |
| Wheat | Flat |
| Cotton | Flat |
| Sugar | Flat |
| Energy | |
| Crude Oil | Long |
| Natural Gas | Flat |
| Gasoline | Long |
| Heating Oil | Long |
All data as of 04/22/2024 and is subject to change at any time and are not recommendations to buy or sell any security. When the positions within the various components are flat, they will be invested in cash and U.S. Treasury Bills. Individual components may vary based on risk levels.
Pricing & Performance
NAV and Market Price information as of 04/25/2024.
Net Asset Value (NAV)
Market Price Closing
| 1M | 3M | YTD | 1Y | 3Y | 5Y | 10Y | Since Inception | Expense Ratio* (Gross / Net%) | Inception Date | |
|---|---|---|---|---|---|---|---|---|---|---|
| COM NAV | 2.52 | 2.71 | 2.71 | -3.36 | 8.85 | 8.28 | — | 5.64 | 0.80 / 0.70* | 03/30/2017 |
| COM Market Close | 2.64 | 2.79 | 2.79 | -3.40 | 8.75 | 8.32 | — | 5.66 | 0.80 / 0.70* | 03/30/2017 |
As of March 31, 2024
The Primary Listing Exchange is the NYSE Arca, Inc.
*The Fund’s adviser, Rafferty Asset Management, LLC (“Rafferty”) has entered into an Operating Services Agreement with the Fund. Under this Operating Services Agreement, Rafferty has contractually agreed to pay all expenses of the Fund as long as it is the advisor of the Fund other than the following: management fees, Rule 12b-1 distribution and/or service fees, taxes, swap financing and related costs, dividends or interest on short positions, other interest expenses, brokerage commissions, expenses incurred in connection with any merger or reorganization, acquired fund fees and expenses, and extraordinary expenses. If these expenses were included, the expense ratio would be higher.
Short-term performance, in particular, is not a good indication of the fund’s future performance, and an investment should not be made based solely on returns. Because of ongoing market volatility, fund performance may be subject to substantial short-term changes. For additional information, see the fund’s prospectus.
Index Information
The Auspice Broad Commodity Index (ABCERI) is a rules-based long/flat broad commodity index that seeks to capture the majority of the commodity upside returns, while seeking to mitigate downside risk. The Index is made up of a diversified portfolio of 12 commodities futures contracts (Silver, Gold, Copper, Heating Oil, Natural Gas, Gasoline, Crude Oil, Wheat, Soybeans, Corn, Cotton, and Sugar) that based on price trends can individually be Long or Flat (in Cash). One cannot invest directly in an index.
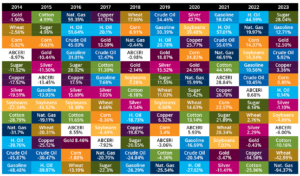
Index Comparison
Calendar Year Total Returns %
Return/Risk Characteristics of ABCERI vs Notable Broad Commodity Indices
| ABCERI | S&P GSCI4 | BCOM5 | DBC CI6 | |
| 2011 | 0.54 | -1.23 | -13.37 | -2.44 |
| 2012 | -1.29 | -0.34 | -1.13 | 3.77 |
| 2013 | -3.27 | -1.28 | -9.58 | -6.60 |
| 2014 | -8.97 | -33.08 | -17.04 | -26.45 |
| 2015 | -13.45 | -32.90 | -24.70 | -26.72 |
| 2016 | 8.55 | 11.00 | 11.40 | 19.15 |
| 2017 | -7.94 | 4.78 | 0.75 | 5.18 |
| 2018 | -0.98 | -15.43 | -12.92 | -12.84 |
| 2019 | -3.06 | 15.17 | 5.44 | 10.60 |
| 2020 | 5.92 | -23.97 | -3.49 | -7.85 |
| 2021 | 28.24 | 40.29 | 27.05 | 42.53 |
| 2022 | 8.71 | 23.52 | 13.79 | 18.86 |
| 2023 | -6.02 | -9.11 | -12.58 | -10.10 |
Data Range: 01/01/2011 – 03/31/2024.
| Annualized Return1 | 1.61 | -2.35 | -2.47 | -0.13 |
| Total Return | 23.98 | -27.28 | -28.49 | -1.72 |
| Annualized Std. Deviation2 | 8.78 | 21.45 | 14.55 | 17.44 |
| Max Drawdown | -43.08% | -79.62% | -66.09% | -64.99% |
Date Range: 01/01/2010 – 03/31/2024
1Annualized Return and past performance does not guarantee future results. Index returns and correlations are historical and are not representative of any Fund performance. Total returns of the Index include reinvested dividends. One cannot invest directly in an index.
2Standard Deviation is a measure of the dispersion of a set of data from its mean.
3Maximum Drawdown is the greatest percent decline from a previous high.
4S&P GSCI Excess Return Index (S&P GSCI), a composite index of commodity sector returns representing an unleveraged, long-only investment in commodity futures that is broadly diversified across the spectrum of commodities
5Bloomberg Commodity Excess Return Index (BCOM), a broadly diversified index that allows investors to track 19 commodity futures through a single, simple measure.
6Deutsche Banc Liquid Commodity Optimum Yield Index (DBC CI), an index composed of futures contracts on 14 of the most heavily-traded and important physical commodities in the world.
Distributions
| Record Date | Ex Date | Pay Date | Income Dividend | Short-Term Capital Gain | Long-Term Capital Gain | Expand |
|---|---|---|---|---|---|---|
| 03/20/2024 | 03/19/2024 | 03/26/2024 | 0.28348 | — | — | |
| 12/22/2023 | 12/21/2023 | 12/29/2023 | 0.19525 | — | — | |
| 09/20/2023 | 09/19/2023 | 09/26/2023 | 0.31414 | — | — | |
| 06/22/2023 | 06/21/2023 | 06/28/2023 | 0.54710 | — | — | |
Record Date03/20/2024 Ex Date03/19/2024 Pay Date03/26/2024 Income Dividend0.28348 Short-Term Capital Gain— Long-Term Capital Gain— Record Date12/22/2023 Ex Date12/21/2023 Pay Date12/29/2023 Income Dividend0.19525 Short-Term Capital Gain— Long-Term Capital Gain— Record Date09/20/2023 Ex Date09/19/2023 Pay Date09/26/2023 Income Dividend0.31414 Short-Term Capital Gain— Long-Term Capital Gain— Record Date06/22/2023 Ex Date06/21/2023 Pay Date06/28/2023 Income Dividend0.54710 Short-Term Capital Gain— Long-Term Capital Gain— | ||||||
Documents
How to Buy
ETFs are generally available for purchase on exchanges, much like stocks—and can be bought and sold throughout the trading day whenever exchanges are open. Direxion ETFs cannot be purchased directly from Direxion, but are available for trading on most trading platforms.
We strongly recommend that you take the time to educate yourself on how ETFs function and behave in various market conditions before you endeavor to trade them in your account. It’s always a good idea to consult a financial advisor or brokerage account representative if you have questions about any ETFs.
Please note, your advisor or broker may charge commissions or other transaction fees. If you have any questions specific to Direxion products, please contact us direct at [email protected] or 866-476-7523.
Overall Morningstar Rating
Overall Morningstar RatingTM out of 100 US Fund Commodities Broad Basket funds based on risk adjusted returns as of 03/31/2024†.
Operational Updates
- 04/17/2024
Q1 2024 COMmodity Recap
Read Full Article - 01/23/2024
Direxion's New ETF Alert Service. Get Price and Volume Alerts automatically via text message!
Set Up Your ETF Alerts Today
Documents & Downloads
How to Buy
While you can't purchase our funds from our website, investors still have multiple options for buying Direxion ETFs.
Learn More About Buying Direxion ETFs
Watch the Video.
Subscribe to Newsletters & Operational Updates
Sign up for email and/or text of the important news, including:
- Fund updates including splits, distributions, launches, and other corporate actions
- Educational events, such as web seminars and conferences
- Our latest research and industry trends


Learn about Non-Leveraged ETFs
We have a wealth of articles and educational resources to provide investors with insights into economic and market events related to help inform your longer-term ETF investing.

The Spotlight Newsletter

Commodities COMmentary