Navigating Market Swings: Bullish Surge or Bearish Shadows for Small Caps?
Editor's note: Any and all references to time frames longer than one trading day are for purposes of market context only, and not recommendations of any holding time frame. Daily rebalancing ETFs are not meant to be held unmonitored for long periods. If you don't have the resources, time or inclination to constantly monitor and manage your positions, leveraged and inverse ETFs are not for you.
2023 was another year for large-cap dominance when it came to equities. But as we come out of the starting gates of 2024, there may be an opportunity brewing in the small cap segment of the equity market, especially in terms of valuations compared to large cap stocks.
Could Macro or Earnings Spark a Bull Run?
Stocks burst to new all-time highs in recent weeks after the Federal Reserve signaled a monetary policy pivot back in December. The market ate up this news, as promise of greater liquidity levels fueled speculators’ appetites.
However, we’ve also seen the U.S. Dollar generally retreat from its highs, which has been a tailwind for equity markets too. But once upon a time, small caps* stocks would outperform large cap* stocks when the Dollar outperformed. The correlation hasn’t held up as well in recent years, but that doesn’t mean it’s gone forever.
We also wrapped up a fairly constructive earnings season a few weeks ago, and traders would be wise to keep a close watch on Q4 results that are set to start coming out shortly. Since inflation* has dropped notably, we could be coming off a strong holiday shopping season.
Traders that think a Dollar rebound or strong earnings may be a boon for small caps in the short run, may find an opportunity with the Direxion Daily Small Cap Bull 3X Shares (Ticker: TNA), which seeks daily investment results, before fees and expenses, of 300% of the performance of the Russell 2000 Index*.
Below is a daily chart of TNA as of January 14, 2024.
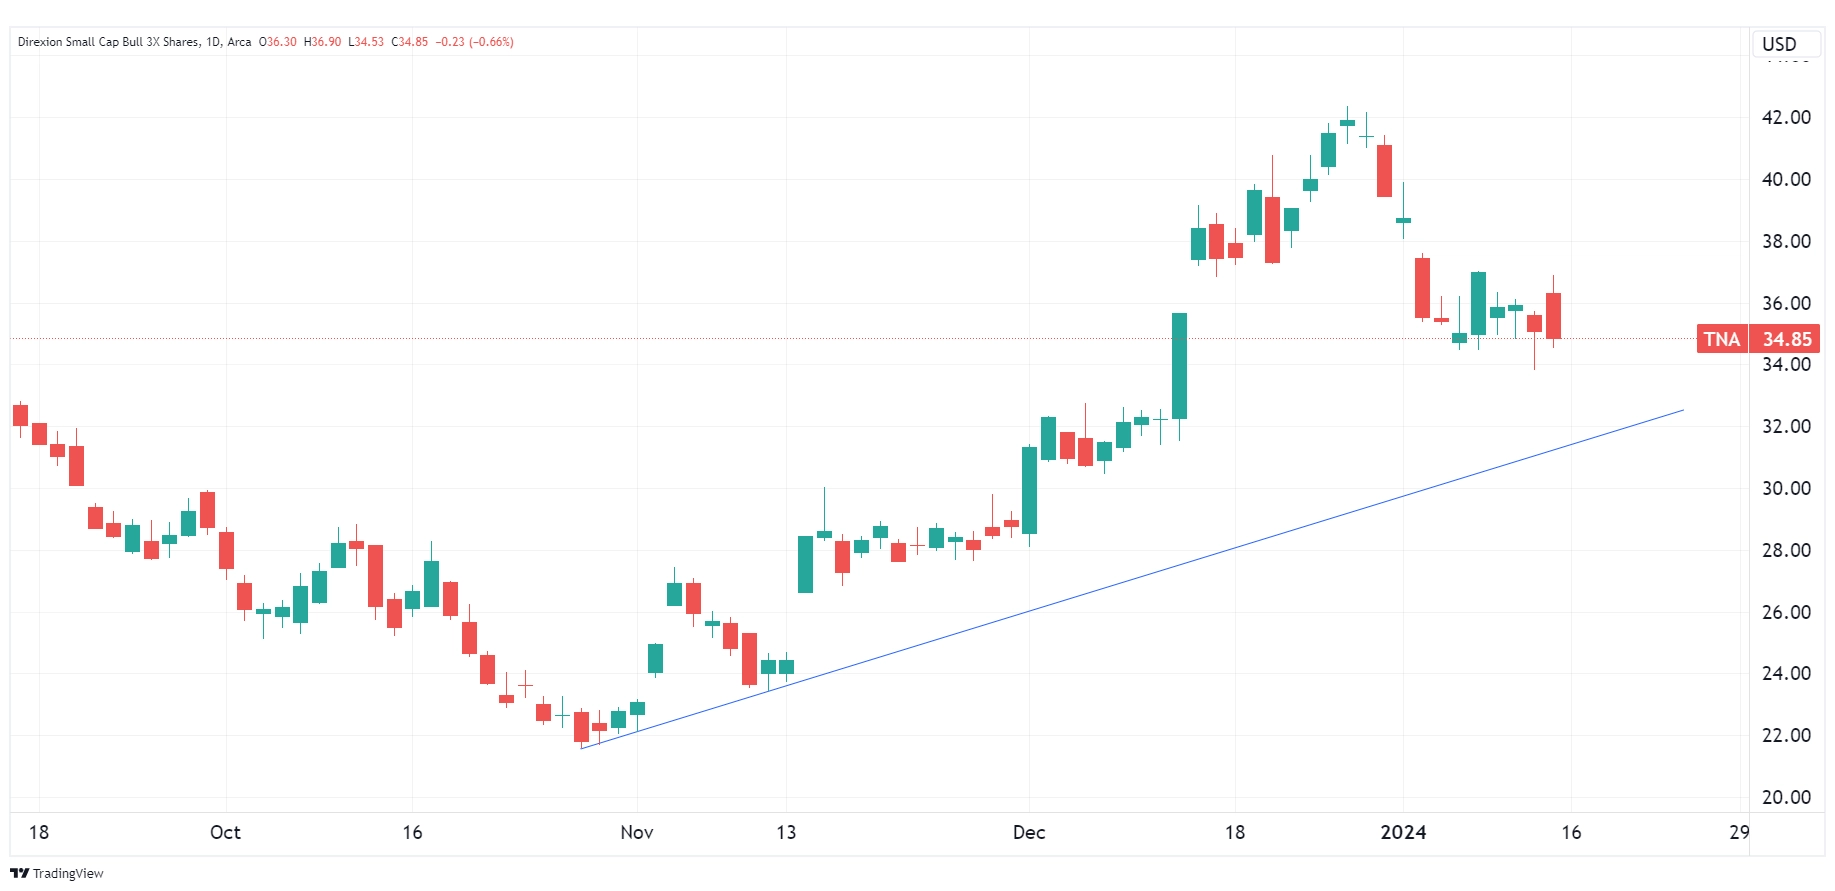
Source: TradingView.com
Candlestick charts display the high and low (the stick) and the open and close price (the body) of a security for a specific period. If the body is filled, it means the close was lower than the open. If the body is empty, it means the close was higher than the open.
The performance data quoted represents past performance. Past performance does not guarantee future results. The investment return and principal value of an investment will fluctuate. An investor’s shares, when redeemed, may be worth more or less than their original cost; current performance may be lower or higher than the performance quoted. For the most recent month-end performance go to Direxion.com/etfs. For standardized performance click here.
The blue line represents an uptrend. An uptrend describes the price movement of a financial asset when the overall direction is upward.
Recession Concerns
The pathway forward for the small cap space isn’t entirely in favor of the bulls. Recession risks remain elevated, especially with respect to the yield curve* being inverted as long as it has now. This points to the possibility of an economic contraction later this year, and it would likely surface in equity markets first.
Traders that think an economic slowdown could lead to another implosion in small cap stocks may have a position with the Direxion Daily Small Cap Bear 3X Shares (Ticker: TZA), which seeks daily investment results, before fees and expenses, of -300% of the performance of the Russell 2000 Index.
Some of the fund’s top holdings include stocks like Super Micro Computer Inc. (Ticker: SMCI), Chart Industries Inc. (Ticker: GTLS), and ChampionX Corporation (Ticker: CHX). Traders would be wise to keep a close watch on the upcoming earnings reports for these companies. SMCI reports on January 30, GTLS reports on February 23, and CHX reports on February 5. Any major misses could be catalysts for some upside in TZA.
To view the fund’s full holdings, click here. Holdings are subject to risk and change.
Below is a daily chart of TZA as of January 14, 2024.
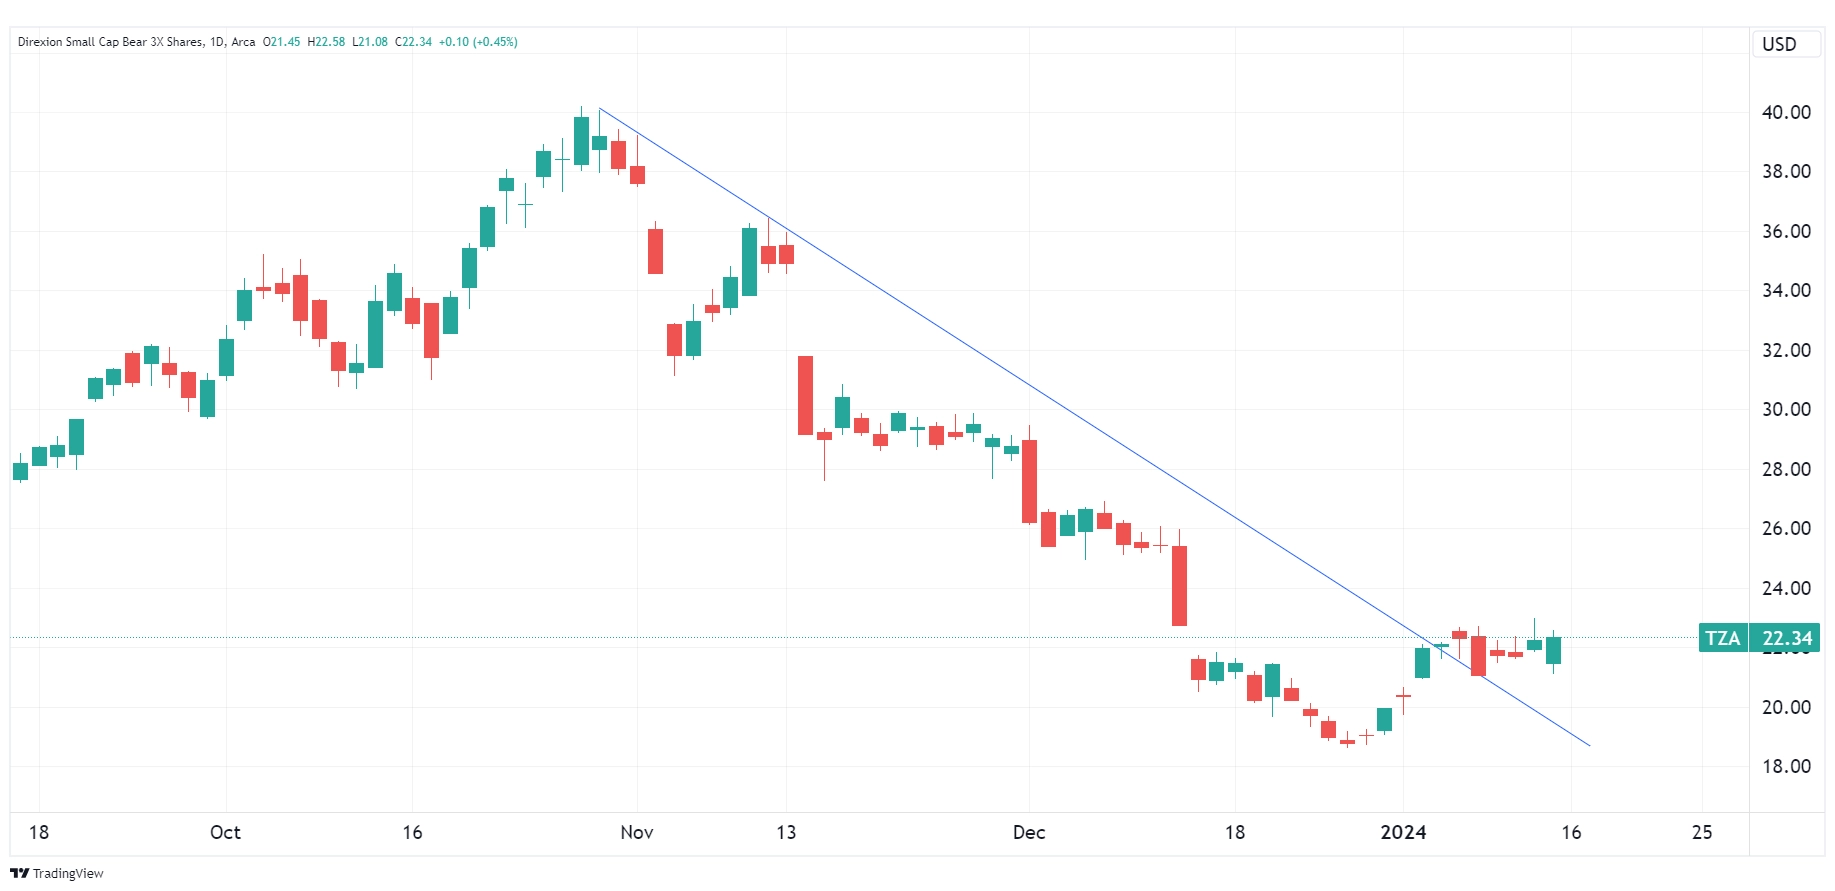
Source: TradingView.com
Candlestick charts display the high and low (the stick) and the open and close price (the body) of a security for a specific period. If the body is filled, it means the close was lower than the open. If the body is empty, it means the close was higher than the open.
The performance data quoted represents past performance. Past performance does not guarantee future results. The investment return and principal value of an investment will fluctuate. An investor’s shares, when redeemed, may be worth more or less than their original cost; current performance may be lower or higher than the performance quoted. For the most recent month-end performance go to Direxion.com/etfs. For standardized performance click here.
The blue line represents a downtrend. A downtrend describes the price movement of a financial asset when the overall direction is downward.
More Equity Plays
Traders looking to trade the large cap sector instead of small caps may be interested in the Direxion Daily S&P 500 Bull 3X Shares (Ticker: SPXL) or Direxion Daily S&P 500 Bear 3X Shares (Ticker: SPXS), which seek daily investment results, before fees and expenses, of 300% and -300%, respectively, of the performance of the S&P 500. There’s also the Direxion Daily Mid Cap Bull 3X Shares (Ticker: MIDU), which seeks daily investment results, before fees and expenses, 300% of the performance of the S&P Mid Cap 400 Index.
Traders seeking international exposure with a bit more risk may find an opportunity in the Direxion Daily MSCI Emerging Markets Bull 3X Shares (Ticker: EDC) or Direxion Daily MSCI Emerging Markets Bear 3X Shares (Ticker: EDZ), which seek daily investment results, before fees and expenses, of 300% and -300%, respectively, of the performance of the MSCI Emerging Markets Index*.
*Definitions and Index Descriptions
An investor should carefully consider a Fund’s investment objective, risks, charges, and expenses before investing. A Fund’s prospectus and summary prospectus contain this and other information about the Direxion Shares. To obtain a Fund’s prospectus and summary prospectus call 866-476-7523 or visit our website at www.direxion.com. A Fund’s prospectus and summary prospectus should be read carefully before investing.
Leveraged and Inverse ETFs pursue daily leveraged investment objectives which means they are riskier than alternatives which do not use leverage. They seek daily goals and should not be expected to track the underlying index over periods longer than one day. They are not suitable for all investors and should be utilized only by sophisticated investors who understand leverage risk and who actively manage their investments.
The Russell 2000® Index is a trademark of Frank Russell Company (“Russell”) and has been licensed for use by the Trust. The Direxion Daily Small Cap Bull and Bear 3X Shares are not sponsored, endorsed, sold or promoted by Russell. Russell makes no representation regarding the advisability of investing in the Direxion Daily Small Cap Bull and Bear 3X Shares.
The Russell 2000® Index measures the performance of approximately 2,000 small-capitalization companies in the Russell 3000® Index, based on a combination of their market capitalization.
The S&P 500® Index (SPXT) is designed to be comprised of stocks that are the 500 leading, large-cap U.S. listed issuers. The securities are selected on the basis of market capitalization, financial viability of the company, sector representation, public float, liquidity and price of a company’s shares outstanding. The Index is a float-adjusted, market capitalization-weighted index.
The S&P MidCap 400® Index (SPTRMDCP) is a float-adjusted market capitalization weighted index that measures the performance of 400 mid-sized companies in the United States.
The MSCI Emerging Market IndexSM (NDUEEGF) is a free float-adjusted market capitalization weighted index that is designed to represent the performance of large- and mid-capitalization securities across emerging markets countries.
One cannot directly invest in and index.
Direxion Shares Risks – An investment in each Fund involves risk, including the possible loss of principal. Each Fund is non-diversified and includes risks associated with the Funds’ concentrating their investments in a particular industry, sector, or geographic region which can result in increased volatility. The use of derivatives such as futures contracts and swaps are subject to market risks that may cause their price to fluctuate over time. Risks of each Fund include Effects of Compounding and Market Volatility Risk, Leverage Risk, Market Risk, Counterparty Risk, Rebalancing Risk, Intra-Day Investment Risk, Other Investment Companies (including ETFs) Risk, Cash Transaction Risk, Tax Risk, and risks specific to investment in micro-cap, small- and/or mid-capitalization securities. Investing in micro-capitalization companies are significantly more volatile as they face greater risk of business failure than companies considered small and/or mid-capitalization companies. Investing in small and/or mid-capitalization securities involves greater risks and the possibility of greater price volatility than investing in larger, more-established companies. Additional risks include, for the Direxion Daily Small Cap Bull 3X Shares, Daily Index Correlation Risk, and for the Direxion Daily Small Cap Bear 3X Shares, Daily Inverse Index Correlation Risk, and risks related to Shorting. Please see the summary and full prospectuses for a more complete description of these and other risks of each Fund.
Distributor: Foreside Fund Services, LLC.